
Telemetry IQ
The Blog for Modern telemetry
Thank you! Your submission has been received!
Oops! Something went wrong while submitting the form.


News
_
3
min read
We built Sawmills to fix observability's two biggest problems: cost and quality. Here's what year one looked like.
After one year out of stealth, Sawmills reflects on how its AI-powered telemetry management platform is helping enterprises cut observability costs by 50–80% while improving data quality — without ripping out existing tools.


-1.png)

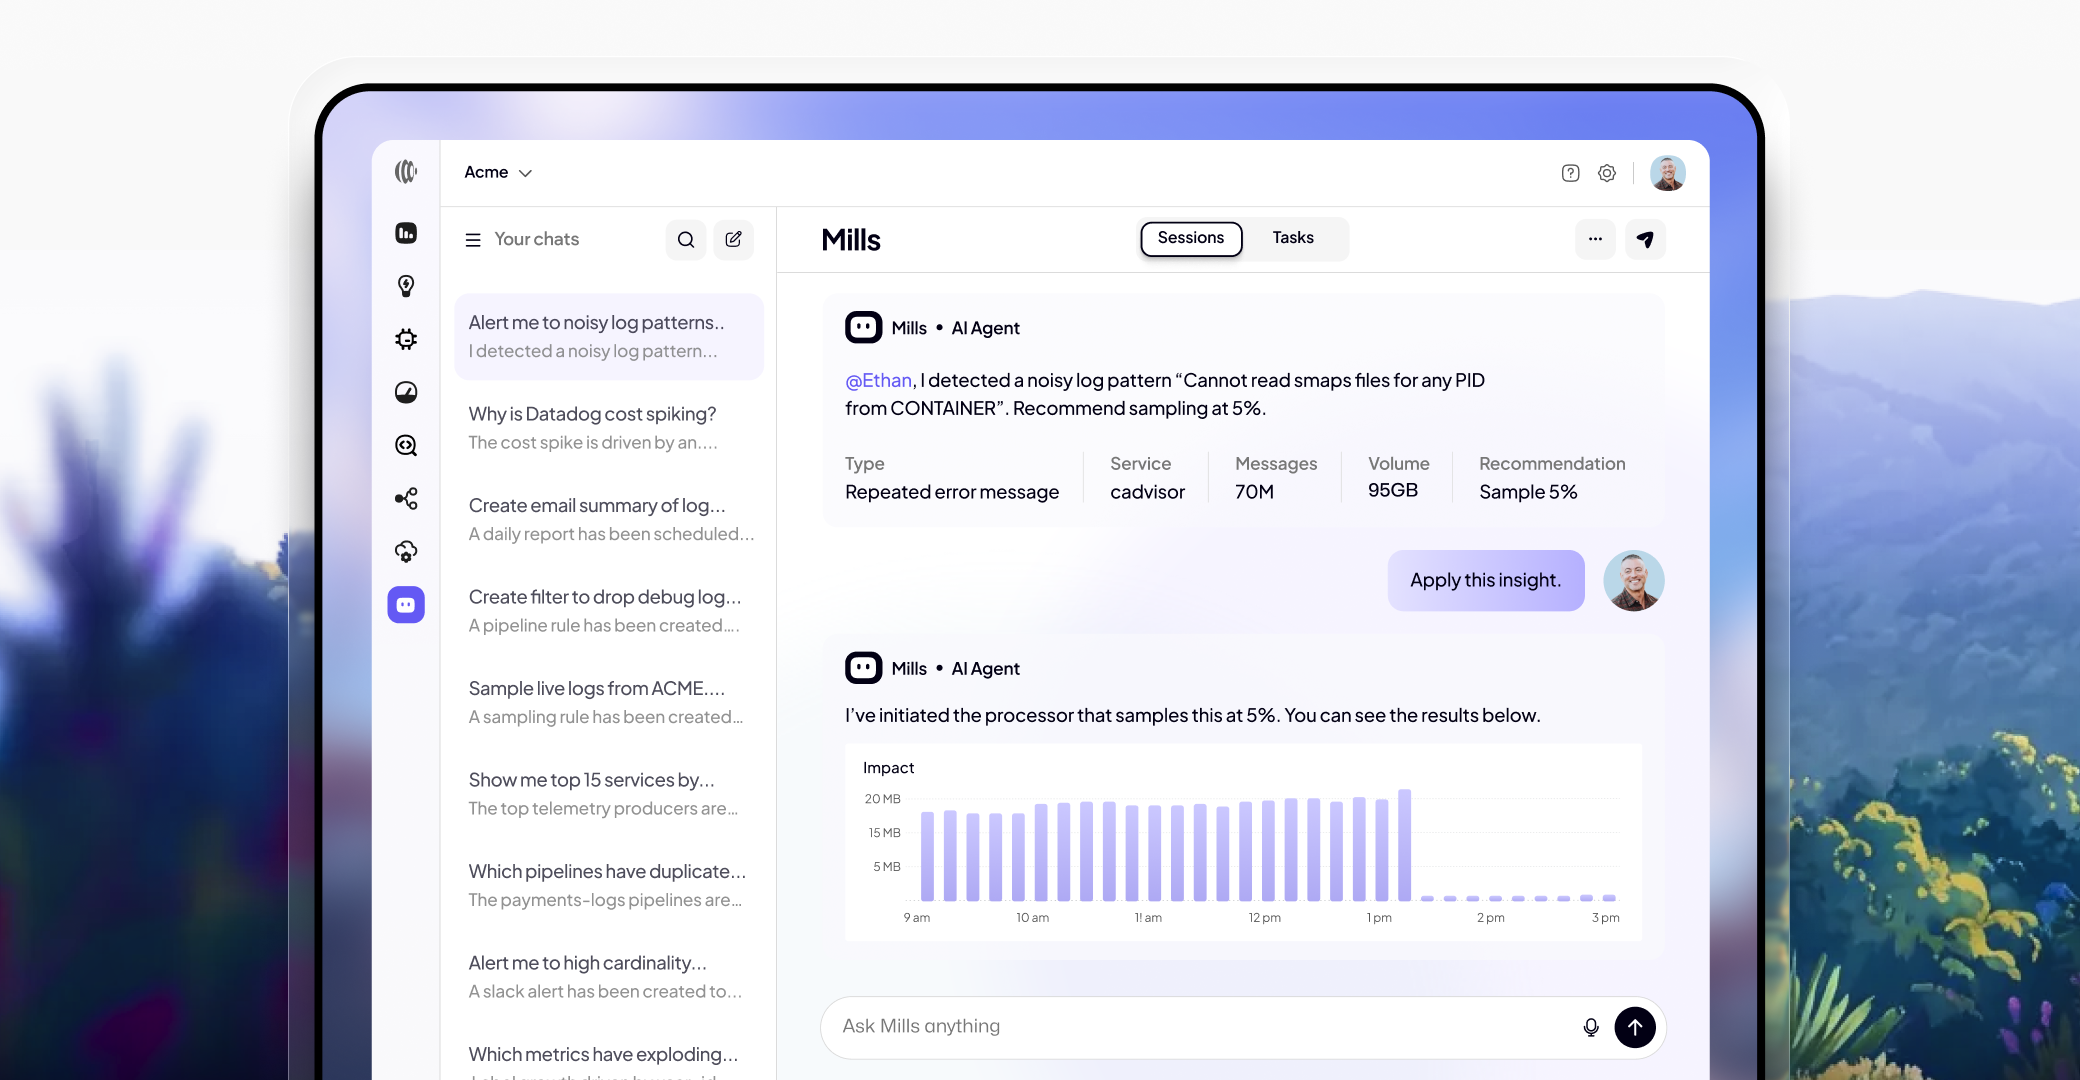
The agentic telemetry platform
Mills works across your entire telemetry lifecycle, from code to production, reducing cost, improving quality, and keeping pipelines reliable.